
Friday, Feb 08
For those not in the know, “Grace” is UCL’s primary High Performance Computing (“HPC”, as opposed to High Throughput Computing or “HTC”) resource and the first service I designed and commissioned. Grace is over three and a half years old now and we are in the process of tendering a replacement which will run alongside Grace for a number of years, before being expanded to replace it.
As bonus material, here is a link to my talk at the launch event for Grace all those years ago!
As part of the procurement for our replacement service for Grace, we’re using the EPCC/Archer/HPC-UK standard benchmarks for GROMACS/CP2K which are available on Github under the GPL v3.0. But an interesting and valid question is “What things affect performance of these benchmarks on the existing system?” Luckily, EPCC have run benchmarks on our related “Thomas” service aka. “the MMM hub” which has the same software stack as Grace and so there are already scripts available to run as part of the repository.
By default, EPCC’s script for GROMACS does a lot of setup where you tell it the characteristics of the machine you are running on, and these need to be adjusted wrt node count and number of cores and tasks per chip, but that done the script can be run.
NOTE - All the results in this post were generated on 12 nodes, 192 cores as this is the same number of cores as EPCC used to benchmark Thomas.
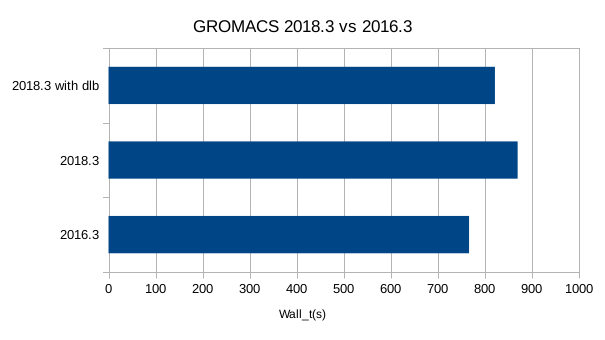
Initially run as is, it chooses one of our older GROMACS installs, 2016.3 so I updated it to 2018.3 and re-ran it and noticed that it ran significantly and reproducibly slower. This is an interesting result in and of itself and it prompts further investigation.
NOTE - another potential source of this is that the 2016.3 module is built with the 2017 Intel compilers while the 2018 one is built with the 2018 ones.
PP/PME load balance
Looking at the log files generated by the runs, it is clear that there is an issue with load imbalance:
NOTE: 18.3 % of the available CPU time was lost due to load imbalance
      in the domain decomposition.
      You might want to use dynamic load balancing (option -dlb.)

NOTE: 5.3 % performance was lost because the PME ranks
      had more work to do than the PP ranks.
      You might want to increase the number of PME ranks
      or increase the cut-off and the grid spacing.
So of course we turn on dynamic load balancing (add -dlb yes to the command line) but it’s still slower than 2016.3. And we are still seeing an issue with load imbalance between the ranks dedicated to PP and those dedicated to PME, which has gotten worse.
 Dynamic load balancing report:
 DLB was permanently on during the run per user request.
 Average load imbalance: 6.3%.
 The balanceable part of the MD step is 66%, load imbalance is computed from this.
 Part of the total run time spent waiting due to load imbalance: 4.1%.
 Steps where the load balancing was limited by -rdd, -rcon and/or -dds: X 0 % Y 0 %
 Average PME mesh/force load: 1.211
 Part of the total run time spent waiting due to PP/PME imbalance: 12.4 %

NOTE: 12.4 % performance was lost because the PME ranks
      had more work to do than the PP ranks.
      You might want to increase the number of PME ranks
      or increase the cut-off and the grid spacing.
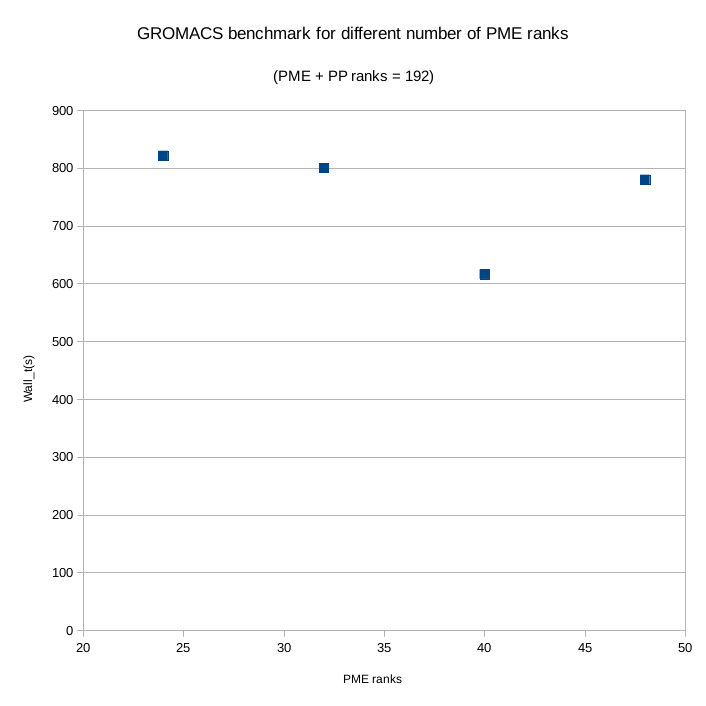
Also, looking at the output of 2018.3 vs 2016.3 and they are doing the split differently, with 2016.3 allocating 32 ranks to PME while 2018.3 has allocated only 24. You can manually control how many of the MPI ranks are allocated to PME at runtime with -npme.
Increasing the number of PME ranks in steps of 8 from 24 we get the figure below, which clearly shows there is a “minimum imbalance” for this problem experienced around -npme 40 after which PME ranks start having to wait for the PP ones to finish.
Hybrid codes, another nail in the coffin?
One of the received wisdoms that I’ve come to disagree with is the idea that if you have a parallel machine made up of large SMPs with an interconnect, it is beneficial to write your code such that it uses OpenMP parallelism inside a node, and then MPI between nodes. This seems intuitively obvious and so it is upsetting when upon actual benchmarking this so rarely seems to be the case. There are a myriad of reasons for this such as yet more load imbalance, implied synchronisation that the developer is not aware of and so on. GROMACS gives us another opportunity to study this as it is easy with environment variables and command line options to control what it does.
The wrapper we wrote for mpirun on our services automatically divides the number of slots by the value of $OMP_NUM_THREADS, allowing us to set one variable to control the degree to which parallelism is controlled by OpenMP vs MPI. I ran same benchmark, with DLB turned on with 1, 2, 4, 8, and 16 OpenMP threads per node (16 is the maximum possible on Grace). This produces the graph below.
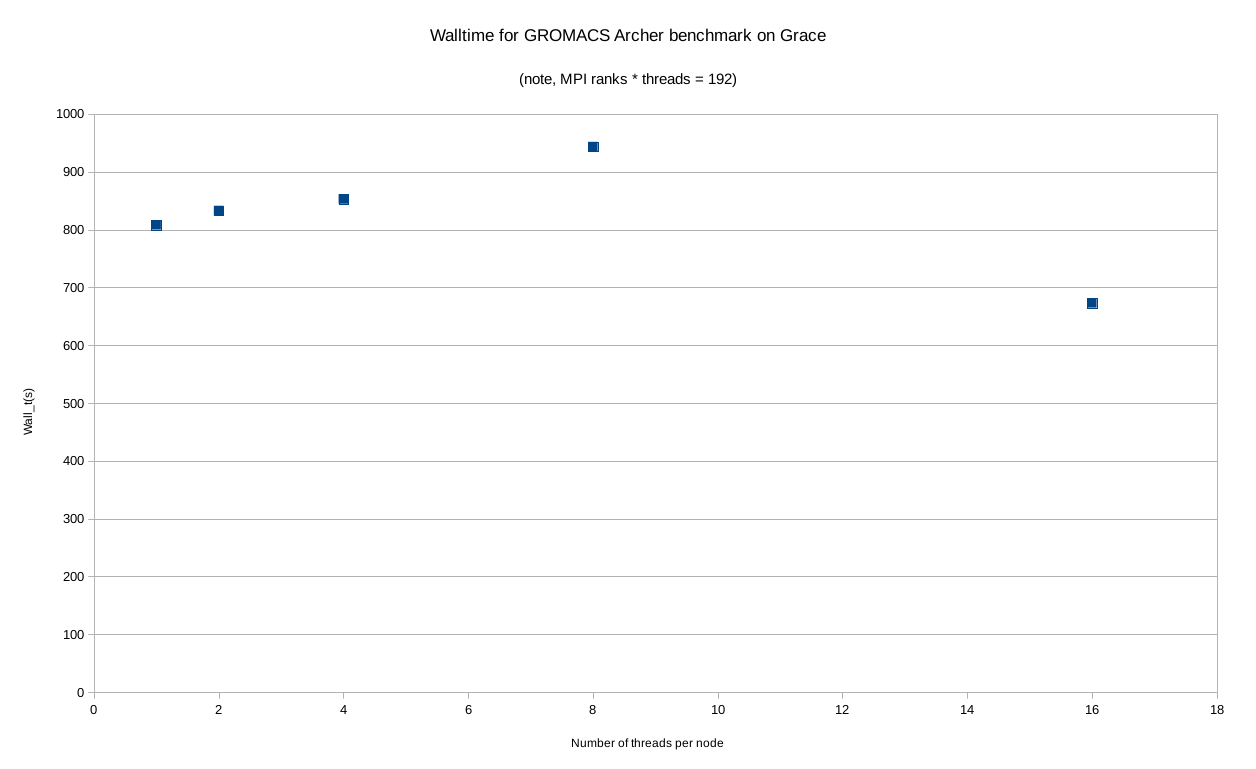
As we can see it initially looks “about what I would expect” i.e. “bad” for OpenMP, with GROMACS getting progressively slower as we increase the thread count. And then at 16 it gets quite a bit better.
So we should ask ourselves, why at 16 threads does it perform so well (although notably, not as well as the MPI version with manual PP/PME split)? And actually, that statement in the brackets is the hint. GROMACS only applies a PP/PME split when it has more than a certain number of MPI ranks and at 16 OpenMP threads per node, it has only 12 MPI ranks and that is not enough to trigger the split. This removes any load imbalance from the split which improves the performance, but still not as much as pure MPI with the manual split. In essence, the effective removal of PME/PP load imbalance by having a low rank count is responsible for the performance improvement.
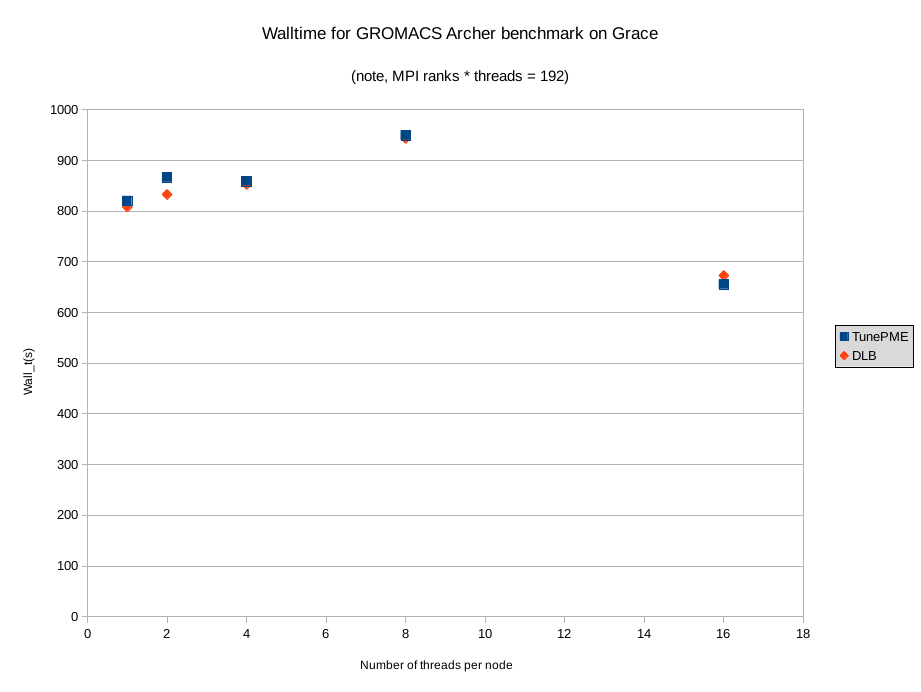
Tuning PME by hand is a pain!
Yes it is. Weirdly, there’s a -tunepme option you can pass to mdrun but it doesn’t seem to do anything. The documentation says it can fight with -dlb so you shouldn’t turn them both on at the same time, so I turned off -dlb and re-ran the OpenMP set. This resulted in GROMACS allocating the same number of cores to the PP/PME split as with -tunepme off so the graph we get actually shows the effect of turning off dynamic load balancing instead. Again we see a significant increase in performance at 16 threads/1 MPI rank per node, because of course GROMACS is no longer doing the PP/PME split. In all my testing I found no evidence that -tunepme does anything for MPI codes.
But my hybrid code does better than my MPI only implementation!
Good for you! It is certain that there are algorithms for which it works, I have just yet to find one that I was actually using for something.